
A First Responder’s Guide to Underground Utilities Mapping
Beneath our cities lies a hidden, complex network of infrastructure. Gas lines, water mains, power cables, and fiber optic networks are all packed together, running under streets, buildings, and parks. Underground utilities mapping is the process of finding and digitally charting this entire subsurface world. It's about creating a detailed, accurate blueprint of everything that's buried right under our feet.
What Is Underground Utilities Mapping and Why Is It Critical?

Picture this: a crew arrives at a major structure fire in the middle of the night. The ground beneath them is a complete black box, a minefield of potential dangers. Every move they make is a gamble. Is there a high-pressure gas line just inches below their engine? Is the water main they desperately need to tap into buried under a collapsed wall? This kind of uncertainty puts crews at immense risk.
Underground utilities mapping brings light to this hidden world. It turns the unknown into clear, actionable intelligence, giving emergency responders the critical foresight they need to operate safely and get the job done. It’s not just a technical survey; for first responders, it’s a lifeline.
Moving Beyond Basic Protocols
Standard “Call Before You Dig” services are a good start, but they’re purely reactive. They give a general idea of what’s underground for a planned dig, but emergencies don't have that luxury. In a crisis, you need proactive knowledge. Accurate, pre-existing maps give an incident commander immediate situational awareness, without having to wait for a utility company rep to show up on scene.
This shift from reactive measures to proactive intelligence is the core of modern emergency management. Knowing the precise location of a gas shut-off valve before an explosion occurs is the difference between a controlled incident and a widespread catastrophe.
This proactive approach is gaining serious ground. The global underground utility mapping market was valued at around USD 1.52 billion in 2025 and is projected to skyrocket to USD 4.08 billion by 2034. A big driver for this growth is the urgent need to prevent utility strikes. These incidents don't just cost the economy over $30 billion a year; they pose a direct, lethal threat to our first responders. You can read more about this expanding market and its huge impact on infrastructure safety.
A Practical Example of Saving Lives and Money
Think about a common emergency call: a fire crew is dispatched to a multi-story building with smoke showing and a strong smell of natural gas.
Without Mapping: The crew arrives and has to start a physical search for the gas shut-off valve. Precious minutes are wasted as the leak gets worse. They might unknowingly park their heavy apparatus right over the compromised gas line, risking a massive failure and explosion. The cost here isn't just wasted time; it's the potential loss of a multi-million-dollar fire engine and the lives of the crew.
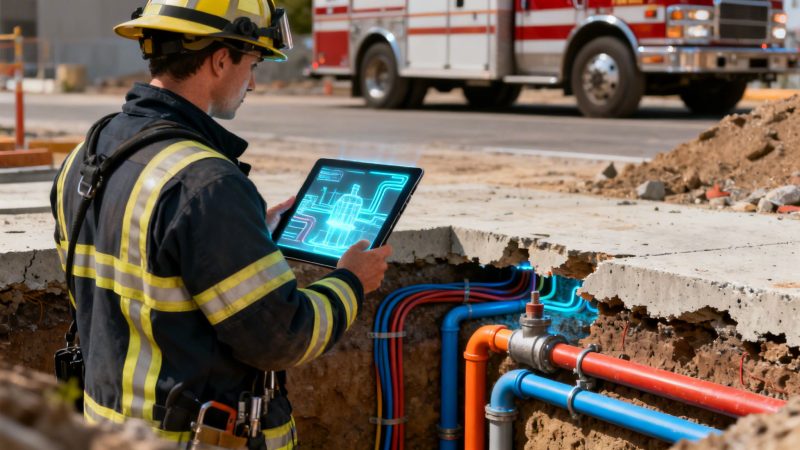
With Integrated Mapping: The second the call is dispatched, the crew's in-vehicle tablets light up with a digital map of the scene. It clearly shows the building's gas line, the exact location of the main shut-off valve out on the street, and all the nearby fire hydrants. The incident commander can immediately send one team member to shut down the gas while others start fighting the fire, all while making sure their vehicles are parked in safe zones.
This simple, actionable information not only prevents a potential explosion but also directly saves money by stopping further property damage and protecting expensive equipment. The fire engine is kept out of the danger zone. The incident is resolved faster, which means fewer resources and personnel hours are needed. It's a clear-cut case for how underground utilities mapping isn't an expense, but an essential investment in both safety and financial resilience.
The Tech That Makes Subsurface Mapping Possible

Seeing through solid ground might sound like something out of a comic book, but for technicians doing underground utilities mapping, it’s just another Tuesday. They aren't using superpowers, but a toolkit of specialized technologies designed to paint a clear picture of what’s happening below our feet without digging a single hole.
Each tool in the kit has its own strengths and is designed to find different kinds of buried infrastructure. Getting to know them is the first step to building a reliable subsurface map that keeps first responders safe. Two of the most common and essential technologies you'll see are Ground Penetrating Radar (GPR) and Electromagnetic Locating (EML).
Ground Penetrating Radar (GPR)
Think of Ground Penetrating Radar (GPR) as a kind of 'sonar for the dirt.' A technician pushes a GPR unit across the ground, and it sends high-frequency radio waves down into the earth. When those waves hit something—a pipe, a void, or even a change in soil type—they bounce back up to a receiver.
The time it takes for that signal to return tells the operator exactly how deep the object is. This method is an absolute game-changer for finding non-metallic pipes and conduits that other tools can’t see.
- Practical Example & Money-Saving Insight: A water main breaks under a busy intersection. Before the excavation can start, crews know there’s a buried PVC sewer line somewhere in the area. A GPR tech sweeps the scene, and the radar clearly picks up the non-conductive plastic pipe, allowing the heavy equipment to dig confidently without causing a secondary, more hazardous spill. Accidentally hitting that sewer line could add tens of thousands in repair costs and project delays. GPR provides the certainty to avoid those costly mistakes.
Electromagnetic Locating (EML)
While GPR is the go-to for non-metallic targets, Electromagnetic Locating (EML) is the workhorse for finding conductive pipes and cables. An EML device is basically a sophisticated radio receiver that 'listens' for the electromagnetic fields surrounding metallic utilities.
It works in two ways. It can passively detect the existing signals radiating from live power cables, or it can be used to actively induce a signal onto a metal pipe with a transmitter. This makes it perfect for tracing the exact path of a specific power, gas, or telecom line from point A to point B.
- Practical Example & Money-Saving Insight: A car crashes into a utility pole, and first responders need to cut the victim out. Using an EML tool in passive mode, a crew member can quickly trace the path of a live, high-voltage underground power line running from the damaged pole. This ensures their hydraulic rescue tools and personnel stay clear of a deadly electrocution hazard. The actionable insight here is that this immediate hazard identification costs nothing but saves everything: it prevents injury to responders and avoids damaging expensive rescue tools, which can run upwards of $20,000.
Fusing Data with Artificial Intelligence
The real magic in modern underground utilities mapping happens when we combine the data from GPR, EML, and other sensors. This is where Artificial Intelligence (AI) has become a powerful ally. AI-driven software takes the raw, complex data from multiple tools and fuses it into a single, cohesive, and easy-to-understand map.
Instead of trying to interpret a confusing mess of squiggles from a GPR and ambiguous beeps from an EML, responders get one unified digital map that clearly labels each utility. It removes the guesswork and provides a single, authoritative view of the subsurface.
These tech leaps are fundamentally changing infrastructure safety for first responders. The combination of GPR and GIS can now achieve a utility detection accuracy as high as 95%, a massive improvement from just 60% in the early 2000s. The development of open-source mapping tools, which mirrors the evolution of platforms like Resgrid, has also helped cut project costs by 40%, making this life-saving tech more accessible than ever. For more on this trend, you can explore the research on underground utility analysis.
Fusing all this data gives emergency teams a serious advantage. When these detailed maps are integrated directly into dispatch and response software, command staff can make smarter, faster, and safer decisions in the field. For agencies looking to improve how their teams are connected, you might be interested in seeing how Resgrid's apps can help.
How Accurate Mapping Saves Money and Protects Lives
Thinking of precise underground utilities mapping as just another expense is a mistake. It's one of the smartest financial and safety decisions an agency can make. The payoff isn't just theoretical; it comes in the form of disasters dodged, projects kept on track, and most importantly, lives protected.
A single accidental utility strike can be financially crippling. Just picture it: an excavator hits a major fiber-optic line. You've got an immediate service outage for thousands, sure, but the real pain comes from the emergency repair costs, massive regulatory fines, and project delays that can tack on tens or even hundreds of thousands of dollars to your budget.
From Costly Accidents to Smart Investments
Accurate mapping takes these worst-case scenarios off the table. It hands crews the intelligence they need to work around buried assets, turning what could have been a catastrophe into just another day on the job. The money saved from avoiding just one major hit can often cover the cost of the entire mapping program.
- Practical Example & Money-Saving Insight: A mid-sized city invested in a full underground utilities mapping program for its old downtown core. In the first year alone, those detailed maps helped them reroute two separate construction projects that were on a collision course with fragile, high-pressure water mains. The estimated savings from sidestepping those two breaks? Over $500,000 in repairs, water loss, and business disruption. The actionable insight is that a proactive mapping investment of around $50,000 for that core area prevented a cost 10 times that amount in a single year.
The takeaway is simple but incredibly powerful: knowing what's under your feet is the single most effective way to get a handle on costs and risk. It shifts project planning from a game of chance to a calculated, data-driven process.
This isn't just about avoiding strikes. It's about proactively protecting expensive public safety assets. An accurate map prevents a multi-million-dollar fire engine from parking over a hidden void from a leaking water main, averting a sinkhole that could destroy the truck and injure the crew. A key part of protecting lives and saving money is solid hazard identification, and you can't do that properly without knowing what's underground.
Lowering Insurance and Boosting Efficiency
The financial upside doesn't stop there. It extends to insurance premiums and day-to-day operational efficiency. The insurance industry is finally catching on, and new insurtech incentives are popping up that offer 0.9-1.2% discounts on premiums for projects that use verified subsurface data. When dispatch centers, especially those on platforms like Resgrid, have this kind of precise intel, it makes a huge difference—slashing emergency response times by as much as 30% in well-mapped zones.
These savings add up fast, making certified mapping a financially sound strategy for any public agency or private contractor. It proves a commitment to safety and fiscal responsibility that insurers are more than willing to reward.
The Human Element of Accurate Mapping
Beyond the balance sheet, the most critical benefit of accurate underground utilities mapping is protecting human life. First responders work in high-stress, unpredictable situations. Giving them a clear picture of subsurface hazards removes a huge layer of uncertainty and risk from their job.
Here’s how it directly keeps responders safe with actionable insights:
- Prevents Explosions: Knowing the exact location of a gas line lets crews set up safe zones and shut off the source before it becomes a disaster. Actionable Insight: Use the map to position apparatus upwind and outside the potential blast radius, saving lives and equipment.
- Avoids Electrocution: Identifying buried power cables is critical to prevent accidental contact during a rescue or emergency excavation. Actionable Insight: Create an exclusion zone 10 feet around any marked high-voltage line, a simple rule that prevents a fatal mistake.
- Ensures Water Supply: Mapping shows crews which fire hydrants and water mains are reliable, keeping them from hooking up to a damaged or out-of-service line when every second counts. Actionable Insight: Pre-plan primary and secondary water sources for high-risk buildings so there's no guesswork during a fire.
At the end of the day, every dollar spent creating and maintaining these essential maps is an investment in the men and women on the front lines. It gives them the information they need to make smarter, safer calls when it matters most.
Integrating Utility Maps with Your Dispatch System
Raw data from an underground utilities mapping survey is valuable, but it only becomes truly powerful when you get it into the hands of your crews in real-time. This is the moment it transforms from a simple dataset into actionable intelligence. Modern utility maps aren't just static PDFs anymore; they are dynamic data layers designed to plug directly into Computer-Aided Dispatch (CAD) and crew management platforms.
This integration is what closes the gap between knowing what’s underground and using that knowledge to make split-second decisions during an emergency. It takes a complex mess of data and turns it into a simple, clear operational picture for both dispatchers and first responders.
A Workflow That Transforms Situational Awareness
Think about a common emergency scenario: a 911 call comes in for a gas leak in a residential neighborhood.
Without integrated mapping, the dispatcher gives the crew a location and a problem. The team arrives on scene essentially blind, forced to rely on their senses and training to assess a volatile situation. They’re wasting precious minutes trying to track down critical infrastructure when seconds count.
With integrated mapping, the workflow is entirely different:
- Instantaneous Data Overlay: The dispatcher takes the call and plugs in the address. Immediately, their dispatch console overlays the incident location with a detailed utility map, highlighting the gas main, shut-off valves, water lines, and nearby fire hydrants.
- Automatic Data Push: This critical information isn't just for the dispatcher. It's automatically pushed to the mobile data terminals and tablets in the responding fire engines and command vehicles.
- Informed On-Scene Arrival: The incident commander shows up already knowing the precise location of key infrastructure. They can immediately establish a safe perimeter, direct crews straight to the shut-off valve, and make sure their multi-million dollar apparatus is never parked over a compromised utility line.
This seamless flow of information turns what could be minutes—or even hours—of dangerous guesswork into seconds of decisive action. It's becoming the new standard for operational command.
Practical Benefits of System Integration
Plugging underground utilities mapping into your dispatch system delivers concrete benefits that save money, protect assets, and keep your people safe. It’s what moves your agency from a reactive footing to a proactive one.
- Practical Example & Money-Saving Insight: A fire department integrated utility maps with their CAD system. During a major warehouse fire, the map showed a single, large-diameter water main feeding all hydrants on the property. A secondary, smaller main was located on an adjacent street. The incident commander, seeing this, immediately assigned a second engine to connect to the secondary main. When the primary main failed due to the fire's intensity, they already had a backup water supply, preventing a total loss of the building. This single decision, enabled by the map, saved an estimated $2 million in property value.
This integration is the final, critical link in the chain of command. It ensures the life-saving intelligence gathered during mapping doesn't just sit in a file but becomes an active tool during every single response, keeping responders from unknowingly operating in a danger zone.
For first responders using platforms like Resgrid, accurate mapping integrates seamlessly with dispatch and personnel tracking, making it possible to send real-time alerts to protect teams on the ground. This approach is being adopted all over the world. The UK's National Underground Asset Register (NUAR), for example, is consolidating data from over 300 asset owners and expects £400 million in yearly efficiency gains just by making safe operations simpler. You can discover more insights about these global mapping initiatives.
This is why so many departments are now looking for dispatch solutions that can handle these advanced data layers. For those exploring what’s possible, you might want to look into the features available in modern dispatch platforms. The ability to integrate GIS data isn't a luxury anymore—it's a core requirement for effective emergency management.
Understanding Data Accuracy Levels and Formats
Just because you have a map of underground utilities doesn't mean it's right. Having bad data can be even more dangerous than having no data at all, and it's a lesson you don't want to learn the hard way. Knowing how trustworthy your underground utilities mapping data is will directly impact your ability to manage risk and make good decisions on the ground.
The industry has a way to grade this data, and it's called the ASCE 38-22 standard. Think of it as a report card for your map's accuracy, with four distinct Quality Levels. Getting familiar with these levels helps you request the right kind of survey for the job. This saves you from overpaying for precision you don't need while ensuring you've got the detail required for high-risk work.
The Four Quality Levels of Utility Data
Each level builds on the last, giving you progressively more confidence in where that pipe or cable actually is. This system is designed so that incident commanders and project managers can match the data's reliability to the specific task, balancing safety and cost.
Quality Level D (QL-D): This is the bottom rung. It's information pulled from existing records, old as-built drawings, or even just someone's memory. This data is totally unverified and should be treated as a very rough guess. It might be okay for broad-strokes planning, like figuring out where utilities could be in a large park, but it's useless for any kind of digging.
Quality Level C (QL-C): This level takes the QL-D records and adds a visual site survey. Someone physically walks the site, correlating the old paperwork with what they can see—things like manholes, valve boxes, and utility poles. It’s a step up from QL-D, but it still doesn't tell you the exact horizontal or vertical position of the buried line.

This visual from ASCE really brings home how standards create a common language for everyone involved to manage risk. Understanding these levels is the first real step toward preventing a very expensive—and potentially tragic—utility strike.
Demanding Higher Accuracy for Critical Tasks
When the shovels come out or you're dealing with a high-stakes emergency, only the top two quality levels will do. Don't settle for less.
Quality Level B (QL-B): Now we're talking about real technology. At this level, technicians bring in geophysical tools like Ground Penetrating Radar (GPR) and Electromagnetic Locators (EML) to actively detect and map utilities from the surface. QL-B gives you a reliable horizontal position, which gives crews a high degree of confidence in where to dig—and, more importantly, where not to.
- Quality Level A (QL-A): This is the gold standard, the absolute highest level of certainty you can get. It involves physically exposing the utility, usually through non-destructive methods like vacuum excavation. This confirms its exact horizontal and vertical position, as well as its size and material. You'd demand QL-A data before building a new fire station or digging next to a high-pressure gas main. No question.
To make sense of these levels, here’s a simplified breakdown of the ASCE 38-22 standard. This table can help you choose the right level of service for your specific project needs.
ASCE 38-22 Quality Levels Explained
| Quality Level | What It Means | When to Use It (Practical Example & Money-Saving Insight) |
|---|---|---|
| QL-D | Records & Recollection: Based on old maps or word-of-mouth. Highly unreliable. | Broad, early-stage planning. Example: Initial feasibility study for a new park. Insight: Free or low-cost, but never use for safety decisions. |
| QL-C | Surface Feature Survey: Combines QL-D data with a visual check for things like manholes or hydrants. | Preliminary site assessment. Example: Checking if old water main plans line up with visible hydrants. Insight: Low cost, good for spotting major discrepancies early. |
| QL-B | Geophysical Detection: Uses tools like GPR/EML to map the utility's horizontal path from the surface. | Pre-excavation checks. Example: Mapping a fiber optic path before digging. Insight: Prevents costly strikes; a typical QL-B survey costing $5,000 can avert a $100,000 fiber cut. |
| QL-A | Physical Verification (Potholing): The utility is physically exposed to confirm its exact 3D location and attributes. | High-consequence excavation. Example: Verifying gas line depth before boring under it. Insight: Highest cost, but essential for avoiding catastrophic failures. |
Ultimately, choosing the right quality level isn't just about compliance; it's about making informed decisions that protect both your people and your community's critical infrastructure.
Data Formats That Enable Integration
Once you have accurate data, it has to be in a format that your other systems can actually use. Otherwise, it just sits in a digital folder, useless. The two most common formats you'll encounter are:
GIS (Geographic Information System): This format is brilliant for layering different types of spatial data. It’s perfect for pulling utility maps into dispatch platforms, letting a dispatcher see infrastructure, property lines, and incident locations all on one screen.
CAD (Computer-Aided Design): This is the language of engineers and architects. It's built for precise design and modeling, making it essential for any construction or engineering project.
Using these standard formats ensures the valuable intelligence from your underground utilities mapping investment doesn't get siloed. It becomes a living, integrated part of your daily operations, from the initial 911 call all the way to on-scene command.
Frequently Asked Questions About Utility Mapping
When you're considering new tech like underground utility mapping, a lot of practical questions come up. It's completely normal. Department heads, incident commanders, and city planners all want clear, no-nonsense answers before they commit time and money. Let's tackle the most common questions we hear, focusing on what really matters for safety, efficiency, and your budget.
What Factors Determine the Cost of Underground Utility Mapping?
There's no simple, one-size-fits-all price tag. Think of it like a home renovation—the final bill depends on the size and complexity of the job. Understanding the moving parts helps you budget smarter.
A few major things drive the cost:
- Area Size: Mapping a single city block is obviously going to be cheaper than an entire hospital campus or industrial park.
- Utility Density: A packed urban core with tangled layers of gas, water, electric, and fiber optic lines is a much bigger challenge than a quiet suburban area with just a few utilities.
- Required Accuracy Level: If you need ASCE Quality Level A verification (which means physically digging to expose the utility), it's going to cost more than a Quality Level B survey that relies on geophysical tools.
- Site Accessibility: An open field is easy. A high-traffic downtown street that requires lane closures and night work? That's tougher and more expensive.
An actionable money-saving insight is to start small. Run a pilot project in a high-risk area, like the grounds around your main fire station or a local hospital. This lets you prove the value and show a clear return on investment before you roll out a city-wide program, putting your budget where it will make the biggest, most immediate impact.
How Long Does It Take to Map a Specific Area?
The timeline for an underground utilities mapping project lines up with the same factors that drive cost: size, complexity, and how accurate you need to be. It’s not an instant process, but it’s a whole lot faster than cleaning up after a utility strike.
Here's a practical example. A typical hospital campus—maybe 50 acres with a decent number of utilities—might take a survey crew two to three weeks for the fieldwork on a Quality Level B survey. That involves using GPR and EML to trace every detectable line. After that, processing all that data and turning it into GIS-compatible maps could take another one to two weeks.
On the other hand, mapping a single one-mile stretch of a major road with extremely high utility congestion might take a full week of fieldwork alone. The key is to have a clear scope from the get-go.
Can This Technology Locate Every Type of Underground Line?
This is a huge question, and the honest answer is that no single piece of tech can find everything. Different tools are built for different materials, which is why a multi-technology approach is the only way to get a complete picture.
- Electromagnetic Locating (EML) is the go-to for conductive materials. Think metal pipes for gas and water, or live electrical cables.
- Ground Penetrating Radar (GPR) is your best bet for non-conductive lines, like PVC water pipes, concrete storm drains, and fiber optic conduits.
- Unlocatable Lines: Let's be real—some things are just tough. Old clay drain tiles or direct-buried fiber optic lines that were installed without a tracer wire can be almost impossible to find with surface tools. This is where Quality Level A (physical digging) becomes non-negotiable if you absolutely must know the exact location.
To save money, don't pay for what you don't need. If you're mainly worried about old metallic gas and water lines, an EML-focused survey could be enough and more cost-effective. But if you're planning major excavation, investing in a combined GPR and EML survey is a must to avoid hitting a plastic pipe and causing a costly, dangerous incident.
What Is the First Step to Get Our Department Started?
Getting started is easier than you think. It all begins by figuring out your most immediate risks and then just starting a conversation with the experts.
The most effective first step is to conduct a small-scale risk assessment. Pinpoint one or two locations in your jurisdiction where a utility strike would be most catastrophic—think near a school, hospital, or major traffic artery. This gives you a clear, data-driven starting point.
Once you’ve picked a target area, the next step is to reach out to a qualified subsurface utility engineering (SUE) firm. They can help you scope out a pilot project and give you a detailed proposal. This helps you get your head around the process and costs without having to make a massive commitment right away. For ongoing questions as you get the system up and running, you can find great resources through a dedicated support and learning center.
At Resgrid, LLC, we believe in giving first responders the best tools and information possible. Integrating accurate utility maps into your dispatch and command system is a critical move toward safer, more efficient emergency operations. See how our platform can bring all your critical data together by visiting https://resgrid.com.