
A Practical Guide to Technology in Mapping
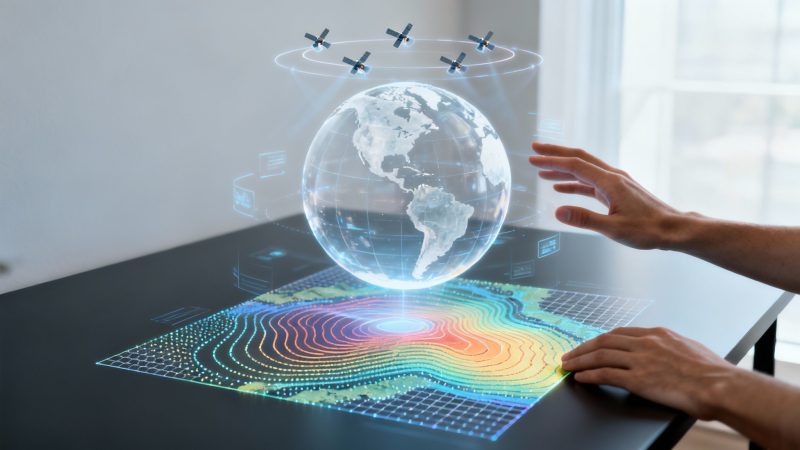
Modern technology in mapping has completely changed the game, moving us lightyears beyond paper charts. What we have now are dynamic, data-rich tools that are the engine behind everything from your daily commute to a complex emergency response. This wasn't an overnight change; it’s the result of decades of innovation in how we see and analyze the world around us. Today's maps aren't just static pictures—they're interactive layers of information that give us incredible insight.
How Modern Mapping Evolved Beyond Paper
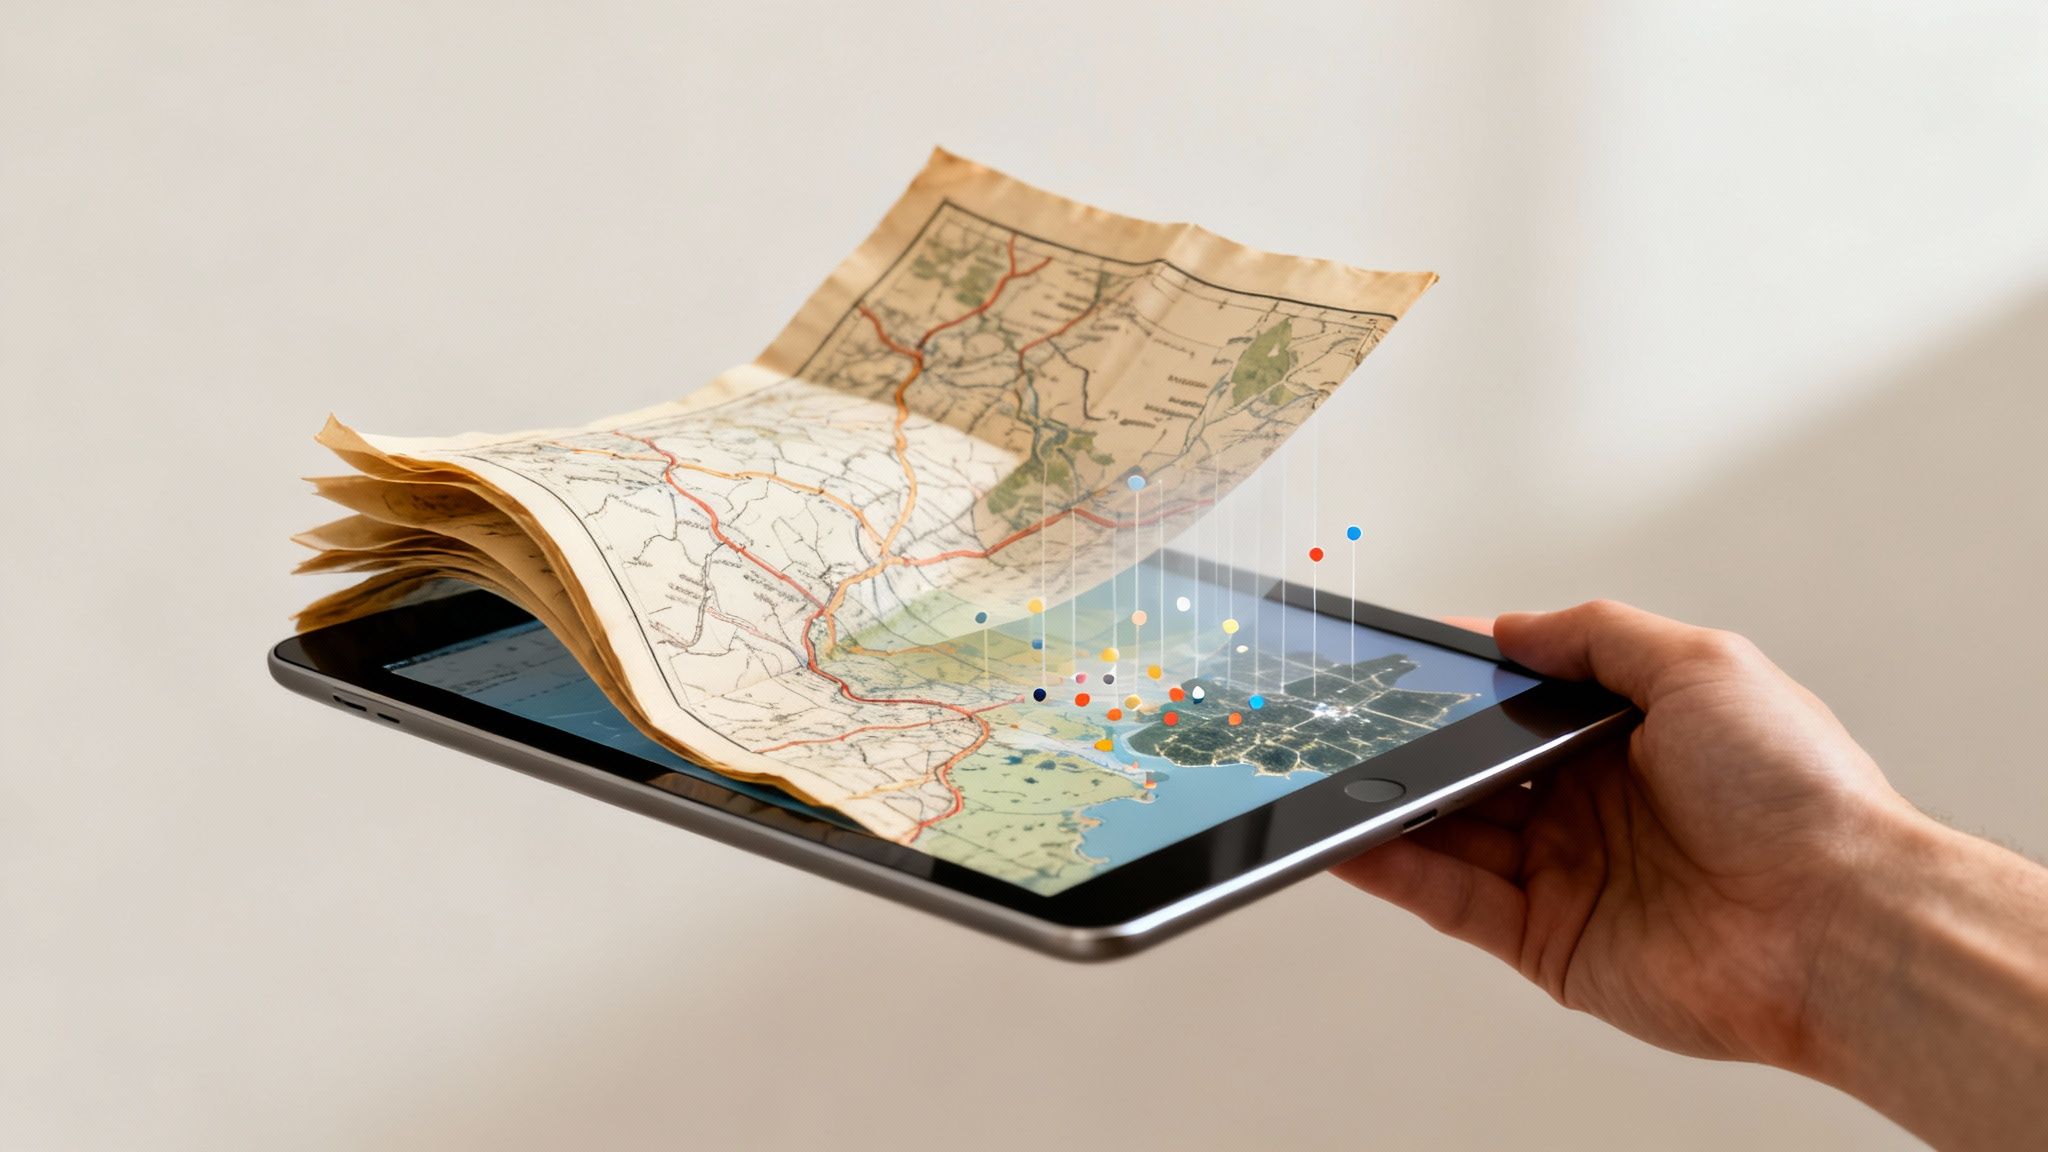
For centuries, maps were painstakingly hand-drawn. They were beautiful, sure, but they were static records of geography. A map could tell you where something was, but it couldn't easily answer why it was there. The first big leap forward came with thematic maps, which started layering specific data—like population density or disease outbreaks—onto geographical layouts. This was the first real step toward using maps for analysis instead of just navigation.
The real turning point, though, came with computers. That new era fundamentally changed how we interact with geographic information, setting the stage for the powerful tools we rely on today.
The Dawn of Digital Cartography
The 1960s kicked off a massive shift with the birth of Geographic Information Systems (GIS). Think of GIS as a digital version of those old thematic maps, but on a completely different level. For the first time, cartographers could stack multiple layers of digital data onto a single base map, creating a rich, searchable resource. This whole concept was pioneered by Canadian geographer Roger Tomlinson, who built the first GIS to manage land and natural resources. The technology's impact was immediate. By 1995, Britain’s Ordnance Survey had already digitized over 230,000 maps, becoming the first country to pull off such a huge electronic mapping project. You can explore more about the history of digital mapping and see how it shapes modern tools.
Another key piece of the puzzle was taking technology that was once restricted and making it available to everyone. The Global Positioning System (GPS), originally a military tool, became a public utility. This blew the doors open for countless consumer and commercial uses, from in-car navigation to tracking delivery fleets. It effectively put a precise location finder in everyone's pocket.
The real power of modern mapping isn't just about knowing where something is. It's about understanding the relationships between location and other data—like traffic, weather, or personnel availability—to make smarter, faster decisions.
From Static Images to Actionable Intelligence
This evolution from static paper to dynamic digital systems has completely redefined what a map can do. Instead of just showing roads and borders, today's mapping technology gives us actionable intelligence that saves time, money, and even lives.
For instance, a logistics company no longer has to rely on a driver’s gut feeling and knowledge of a city. Instead, it uses real-time maps that layer in crucial data points:
- Live traffic data to dodge congestion and cut down on fuel costs.
- Vehicle telematics to monitor speed and driving behavior, which can help lower insurance premiums.
- Optimal routing algorithms to plan the most efficient multi-stop delivery routes, saving big on labor and vehicle wear and tear.
Actionable Insight: By using a system that optimizes routes based on live traffic, a local delivery fleet of just 10 vans can save thousands of dollars per month. A 15-minute reduction in drive time per vehicle each day adds up to over 50 hours of saved labor and fuel costs monthly.
Understanding the Core Mapping Technologies
To really get a handle on modern mapping, you have to look under the hood at the technologies making it all possible. These aren't just buzzwords; they're the engines that chew through raw location data and spit out intelligence you can actually use. Once you see how each piece works, you'll start spotting all sorts of opportunities to tighten up your own operations and save some serious cash.
Let's break down the big four. No dry, academic definitions here—just practical analogies and real-world examples that show you what they're all about.
GIS: The Digital Filing Cabinet for Locations
Picture a massive filing cabinet, but instead of manila folders, every drawer holds information for a specific location. Inside, you can stack layers of data—road networks, property lines, population density, or even the live location of your team. That's the core idea behind a Geographic Information System (GIS).
GIS is the software that lets us stack all these different datasets onto a single map. It's not just about seeing where things are; it’s about understanding the relationships between them. For instance, a city planner can use GIS to overlay zoning rules, traffic patterns, and utility lines. Suddenly, that combined view makes it obvious where the best spot for a new park is or which intersections are causing the worst traffic jams.
The image below gives you a sense of how GIS can layer different types of spatial data—like hydrology, elevation, and land use—to build a comprehensive, interactive map.
This ability to layer information is what turns a basic map into a powerful tool for making decisions, revealing patterns you'd never spot in a spreadsheet.
Money-Saving Insight: A logistics company can throw its past delivery routes and fuel consumption data into a GIS. By layering this with traffic data, it can identify specific routes and times of day that are consistently inefficient. Redesigning delivery schedules to avoid these peak congestion times can slash fuel costs by 15-20% and reduce vehicle wear.
GNSS: The Cosmic Timekeeper
Whenever you hear someone say "GPS," what they're usually talking about is one type of Global Navigation Satellite System (GNSS). The easiest way to think of GNSS is as a giant, cosmic clock. A whole constellation of satellites is constantly zipping around the Earth, each one beaming out a hyper-precise time signal.
Your phone or a tracker in your vehicle listens for these signals from several satellites at once. By measuring the tiny, fractional differences in when each signal arrives, the device triangulates its exact position on the planet. This constant, reliable positioning is the absolute foundation for any kind of real-time tracking and navigation.
Practical Example: Emergency services live and die by GNSS for accurate dispatching. A 911 call comes in, and the system instantly pings the live GNSS location of every unit to find the closest one. This chops down response times when every second is critical. This level of precision is a key part of platforms managing first responder logistics, like what we've built into Resgrid. To see how this works with other tools, you can explore the full range of dispatch and mapping features they offer.
LiDAR: Mapping with Light
So, if GNSS tells you where you are, Light Detection and Ranging (LiDAR) tells you the exact shape of everything around you. Imagine a device that shoots out millions of invisible, completely harmless laser beams every single second. By timing how long it takes for that light to hit something and bounce back, LiDAR builds an incredibly detailed 3D map of its surroundings, often called a "point cloud."
This is the tech that lets self-driving cars "see" the road, pedestrians, and other cars with almost perfect accuracy. It's also what foresters use to measure the height and density of a forest without ever stepping foot inside it.
LiDAR takes us way beyond a flat, 2D map. It gives us a high-fidelity 3D model of reality. That level of detail is crucial for anything that requires precise physical measurements, from planning a construction site to assessing flood risks.
Money-Saving Insight: Before breaking ground on a new building, developers can fly a LiDAR-equipped drone over the property. In just a few hours, they get a survey-grade topographical map that’s far cheaper and faster than sending out a traditional survey crew. This catches potential issues, like drainage problems, early and prevents expensive foundation rework that could cost tens of thousands of dollars.
Remote Sensing: Earth’s Health Checkup from Space
Remote Sensing is all about gathering information on the Earth's surface from a distance, usually from satellites or aircraft. Think of it as giving the planet a regular health check-up from orbit. Satellites with special sensors can "see" things our eyes can't, like tiny changes in soil moisture, the health of crops, or how forest cover is changing over the years.
Practical Example: A large agricultural company uses satellite imagery to monitor thousands of acres. The sensors can pick up on subtle color shifts in the crops that signal stress from dehydration or pests—long before a farmer on the ground would ever notice. This allows them to apply water or pesticides with precision drones only where needed, saving thousands on resources and boosting the final harvest yield.
To put it all together, here’s a quick rundown of these core technologies and what they do best.
Modern Mapping Technologies at a Glance
| Technology | Core Function | Primary Use Case Example |
|---|---|---|
| GIS | Storing, analyzing, and visualizing layered location-based data. | A city planning department layering zoning, traffic, and utility data to find the best site for a new school. |
| GNSS/GPS | Providing precise, real-time location coordinates anywhere on Earth. | An ambulance being dispatched to the closest available unit based on live vehicle tracking. |
| LiDAR | Creating highly detailed 3D models of physical environments using lasers. | A self-driving car "seeing" its surroundings to navigate safely and avoid obstacles. |
| Remote Sensing | Gathering data about the Earth's surface from satellites or aircraft. | An agricultural firm using satellite imagery to monitor crop health and detect drought stress early. |
Each of these technologies is powerful on its own. But the real magic happens when they start working together, feeding data into a single, cohesive system that gives you a complete operational picture.
Combining Data for Powerful Geospatial Insights
The real magic of modern mapping isn’t found in any single technology. It's all about how these systems blend different kinds of data into one comprehensive, unified picture. Think of it like a symphony; a solo violin sounds nice, but it’s the combination of strings, brass, and percussion that creates something truly powerful. Geospatial mapping does the same thing, integrating everything from 3D laser scans and satellite imagery to real-time traffic data and demographic stats.
This idea of layering information is actually pretty old. While new tech like aerial photography and 3D laser scanning has completely changed the game in terms of precision, the core concept has been around for centuries. Back in the 1830s, Parisian officials mapped cholera outbreaks using one of the first-ever heat maps. It was a groundbreaking use of early geospatial analytics that helped them track disease patterns by layering health data onto a city map.
The principle is the same today, but our tools are infinitely more sophisticated. This is where technologies like GIS, GPS, and LiDAR really come together to tell a story.
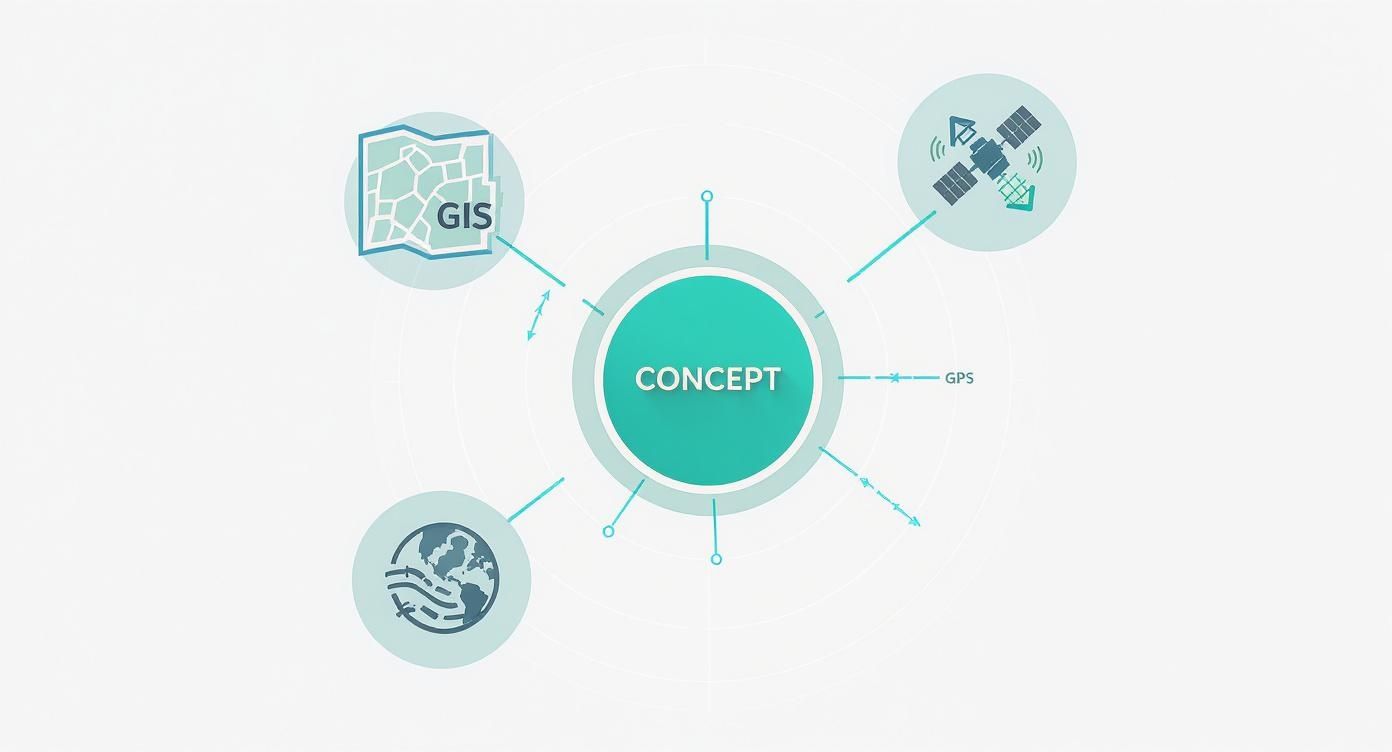
You can see how GIS acts as the central hub, pulling in precise location data from GPS and detailed 3D environmental models from LiDAR. The result is a multi-layered, intelligent map that's far more useful than any single piece of data on its own.
Turning Raw Data into Actionable Intelligence
This data fusion is where mapping technology really proves its worth. It takes what would otherwise be a chaotic flood of raw numbers and coordinates and turns it into clear, actionable intelligence that can save money, improve outcomes, and even save lives. By seeing multiple datasets in a spatial context, you start to uncover hidden patterns and relationships that would be impossible to spot otherwise.
Picture a modern emergency response team handling a major incident. They aren't just looking at a static street map anymore. Their command center displays a dynamic GIS that overlays several real-time data feeds:
- Live Traffic Conditions: They can see which roads are clogged or blocked, letting them dispatch units via the fastest possible routes.
- Weather Radar: A severe storm might make certain areas unsafe due to flooding or high winds, which is critical info for crew safety.
- Infrastructure Maps: They can instantly pinpoint the location of fire hydrants, gas lines, or electrical substations near the incident.
This integrated view lets a dispatcher make split-second decisions that are both faster and safer, directly impacting the outcome of the emergency.
The real value of geospatial technology is its ability to answer complex questions by visualizing the intersection of what, where, and why. It connects disparate pieces of information, revealing the story hidden within the data.
Practical Applications and Financial Savings
The ability to combine diverse datasets isn't just for large-scale operations. When you bring various data sources together for a specific location, advanced site plan rendering techniques can help visualize complex information clearly, offering powerful insights for projects of any size.
A retail chain planning a new store location uses this exact approach to minimize risk and maximize potential profit. They don’t just pick a spot that looks busy; they use GIS to layer multiple datasets to find the absolute best site.
Cost-Saving Example: A Retailer
- Demographic Data: They map out neighborhoods by income level, age, and family size to ensure the local population is a match for their target customer.
- Competitor Locations: They plot every competing store to identify underserved areas and avoid oversaturated markets.
- Traffic Flow Data: They analyze vehicle and foot traffic patterns throughout the day to make sure the location has high visibility and is easy to get to.
By combining these layers, the company can predict a new store's potential revenue with much higher accuracy. This data-driven strategy prevents them from investing millions in a location that's doomed to fail, saving an immense amount of capital and ensuring a stronger return on their investment. This strategic use of layered data is the core of modern technology in mapping.
Driving Efficiency in Emergency Response and Logistics
In fields where every second counts, modern mapping technology isn't just a helpful tool—it's the command center. For emergency services and logistics companies, seeing assets, incidents, and routes in real-time isn't about convenience. It can be a matter of life and death or the difference between profit and loss. This is where the power of GIS and GNSS gets very real, very fast.
Platforms built for these high-stakes environments give dispatchers a live, bird's-eye view of everything happening on the ground. They can track crew locations, see vehicle status, and pinpoint incident sites on a dynamic map, turning a chaotic situation into a coordinated, intelligent response.
Real-Time Command and Control in Action
Picture a multi-vehicle pile-up on a major highway. Without modern mapping, a dispatcher is juggling fragmented information—crackling radio calls, vague location estimates, and a heavy dose of gut instinct. With an integrated system, their screen becomes a tactical overview. They see the precise GNSS location of every available ambulance, fire engine, and police car.
But it's about more than just seeing dots on a map. This tech empowers them to make split-second, data-driven decisions. The system can automatically flag the closest available units and crunch the numbers to find the fastest routes, actively navigating around the very traffic jam the accident just created.
You can see below how a dispatcher gets a clear visual of multiple units, making resource management intuitive and immediate.
![]()
This kind of real-time situational awareness is a game-changer. It ensures the right people with the right equipment get to the right place as quickly as humanly possible, which has a massive impact on outcomes.
Pinpointing Actionable, Money-Saving Insights
Beyond the immediate tactical advantage, consistent use of technology in mapping generates a goldmine of data that translates directly into real savings. Every decision becomes an opportunity to be more efficient, and these platforms automate that optimization. The cost benefits show up all over the budget.
The real financial win with mapping technology comes from turning every single operational action—from dispatching a truck to planning a route—into a chance to be smarter. It systematically cuts out waste, one mile and one minute at a time.
This isn't just about finding the shortest path from A to B. It’s about a more strategic, intelligent way of deploying expensive resources, which sends positive ripples through the entire organization's finances. For teams looking to get these capabilities, checking out the various mobile and desktop tools, like those in the Resgrid apps suite, is a great place to start.
How Optimized Mapping Saves Money
Let's get specific about how this technology slashes costs. These aren't just one-off wins; they are savings that compound over thousands of calls and deliveries.
-
Reduced Fuel Consumption: This is the most obvious one. Optimized routing that avoids traffic, cuts down on idling, and eliminates unnecessary mileage can take a huge bite out of a fleet's fuel budget. Actionable Insight: A delivery service that implements smart routing can see an average fuel savings of 15% or more, which for a mid-sized fleet can easily translate to tens of thousands of dollars saved annually.
-
Lower Vehicle Maintenance Costs: Fewer miles on the road means less wear and tear on engines, tires, and brakes. This simple fact extends the life of every vehicle, reduces the frequency of expensive repairs, and keeps your key assets in service where they belong.
-
Faster Response and Delivery Times: For first responders, a faster response can mean less property damage in a fire or better patient outcomes, which has real economic benefits for a community. In logistics, faster deliveries lead to happier customers and the ability to squeeze more jobs into a day, directly boosting the bottom line.
-
Smarter Resource Allocation: Good mapping prevents over-dispatching—sending three units when one would do. With a crystal-clear picture of the scene and asset proximity, dispatchers send exactly what's needed, saving on personnel hours and fuel while keeping other units free for the next call.
What to Consider Before Implementing Mapping Tech
Jumping into new mapping technology is about more than just picking the flashiest platform. If you want to get it right, you need a crystal-clear understanding of your specific needs and what's actually out there. Making smart decisions upfront means your investment pays off in real-world efficiency and savings, instead of just becoming another source of frustration.
Your success really boils down to a few critical factors. Before you commit to anything, you've got to take a hard look at your data sources, nail down your accuracy requirements, figure out how a new system will play with your existing tools, and lock down the security needed to protect sensitive information.
Choosing Your Data Sources
The foundation of any good map is good data. You generally have two ways to go: commercial or open-source. Commercial data providers offer high-quality, curated datasets that are often ready to use right out of the box, which can save you a ton of time. Of course, that convenience comes with licensing fees that can add up.
On the other hand, open-source data, like from OpenStreetMap, is free and backed by a global community. While this is a fantastic way to keep costs down, the data quality can be a mixed bag. It might require a good bit of cleanup and validation before it’s ready for professional use.
Actionable Insight: For mission-critical operations like emergency dispatch, a hybrid approach is often the sweet spot. Use reliable commercial data for your primary road networks, then supplement it with open-source data for smaller details like local parks or trails. This way, you get the best of both worlds—balancing cost and quality without compromising on reliability.
Defining Your Accuracy Needs
Not every job demands the same level of precision. The accuracy you need is tied directly to the task at hand, and paying for more than you need is a quick way to burn through your budget. Think of it as the difference between needing a general direction versus needing to make a surgical incision.
A city planner mapping out potential zones for a new park can get by just fine with accuracy within a few meters. But a delivery service that relies on real-time navigation needs sub-meter precision to guide drivers to the right doorstep, not just the right street. Getting this wrong can lead to costly mistakes and operational chaos.
The key is to match the technology's precision to the operational tolerance for error. Overinvesting in pinpoint accuracy for a task that doesn't need it is just as inefficient as underinvesting for a mission-critical one.
Ensuring System Interoperability
Your new mapping tool isn’t going to live on an island. It has to communicate seamlessly with your other systems, whether that’s your CRM, dispatch software, or reporting dashboards. Without that connection, you're just creating isolated data silos that force people into manual data entry and kill any chance of a unified operational view.
Look for solutions built with open APIs (Application Programming Interfaces). A good, open API acts like a universal translator, letting different software programs share information automatically. This ensures your mapping platform can both pull data from and push data to your other essential tools, creating a workflow that actually works.
Prioritizing Security and Privacy
Location data is incredibly sensitive stuff. It can reveal where your people are, where your assets are stored, and the daily routes they take. Protecting this information is absolutely non-negotiable, especially when you're dealing with public safety or valuable commercial assets.
When you're evaluating a platform, you need to scrutinize its security protocols. Here are the key features to look for:
- Data Encryption: This ensures data is unreadable, both when it's just sitting on a server (at rest) and when it's being sent over a network (in transit).
- Access Controls: This lets you define exactly who can see what information, limiting access on a strict need-to-know basis.
- Compliance with Regulations: If you operate in regions with tough data privacy laws, adherence to standards like GDPR is a must.
Failing to secure your location data can open you up to serious operational risks and legal liabilities. It’s vital to understand the full scope of a platform’s security measures. For a deeper dive into what robust protection looks like, you can learn more about the security frameworks used in modern dispatch platforms by exploring Resgrid’s security protocols.
The Future of Mapping with AI and Digital Twins
The next big leap in mapping is already happening, and it's being driven by artificial intelligence and the rise of virtual worlds. We're seeing maps evolve from static snapshots of the world into proactive, predictive models that can tell us what's coming next.
Think about it this way: instead of just showing current traffic, future maps will predict congestion an hour from now with startling accuracy. This is all thanks to machine learning algorithms chewing through massive amounts of historical and real-time data.
AI and Predictive Analytics
Artificial intelligence is the real engine behind this new generation of mapping. Machine learning models can now scan satellite imagery to automatically spot deforestation in the Amazon, identify damaged buildings after a hurricane, or even forecast agricultural yields.
These are tasks that used to take teams of people weeks of painstaking manual work. Now, we can get these insights at a speed and scale that were just unimaginable a few years ago.
Practical Example: An insurance company uses AI to analyze aerial photos right after a major storm to assess property damage. Instead of waiting weeks for adjusters to visit every home, they can process claims in hours. This drastically cuts operational costs and gets funds to policyholders faster, improving customer satisfaction.
The next frontier isn't just about mapping what is, but simulating what could be. By creating living digital replicas of our physical world, we can test ideas, predict outcomes, and optimize systems without any real-world risk.
Digital Twins and Immersive Realities
One of the most powerful concepts emerging right now is the digital twin. This isn't just a static 3D model; it's a dynamic, virtual replica of a physical object, a process, or even an entire city.
A digital twin of a city is a living simulation, constantly fed with real-time data from sensors spread across the urban landscape. City planners can use it to simulate the impact of a new subway line on traffic flow or model the most effective evacuation routes for an emergency.
This kind of simulation capability can save an enormous amount of money by helping us avoid costly mistakes in the real world. You can test a new traffic light pattern in the digital twin to see if it actually works before ever sending a crew out to reprogram the physical signals.
Augmented Reality (AR) is another key piece of the puzzle, layering digital information right on top of our view of the physical world.
- For field technicians: An AR headset could show them exactly where underground pipes or electrical lines are buried, preventing expensive and dangerous accidents during a dig.
- For urban planners: AR can visualize how a proposed skyscraper will look on the actual city skyline, giving stakeholders a much clearer picture to inform their decisions.
We're already seeing this technology in action. Projects like Extended Reality (AR/VR) in Catchment Care are showing how immersive tech can help us visualize complex environmental data for better management. All these future-facing technologies are making our maps as dynamic and interactive as reality itself.
A Few Common Questions About Mapping Tech
Diving into mapping technology usually brings up a handful of practical questions. It's totally normal. Getting some straight answers is the best way to feel confident you're picking the right tools for your team. Here are a few of the most common things we hear from people just starting out.
What's the Real Difference Between GIS and GPS?
It’s super easy to get these two mixed up, but they do completely different jobs. I like to think of it like this: GPS is the tool that tells you exactly where you are on the planet, giving you those precise coordinates from satellites. GIS, on the other hand, is the software that helps you understand what that location actually means by layering it with other important information.
For instance, a GPS unit in one of your trucks gives you its exact latitude and longitude. A GIS platform takes that single dot on the map and shows you the whole story—things like live traffic, where your customer sites are, and the most efficient routes. One finds the point; the other paints the entire picture around it.
How Can a Small Business Possibly Afford These Advanced Mapping Tools?
You might think that powerful mapping software comes with a crazy price tag, but that’s not always the case. A lot of smaller organizations get incredible results by leaning into open-source solutions. Tools like QGIS give you serious GIS power for free, and map data from places like OpenStreetMap provides a solid, no-cost foundation for things like routing and visualization.
Actionable Insight: The smartest way to start is with a hybrid approach. Use free, open-source tools like QGIS for your core analysis. Then, plug in specialized, paid services only where you need them most, like a subscription for real-time traffic data. This keeps your initial investment extremely low while still giving you access to powerful, money-saving features.
What’s the Single Biggest Hurdle in Keeping Map Data Accurate?
Honestly? The biggest headache is that the real world just won't sit still. New roads get built, businesses move or shut down, and traffic patterns change with the seasons. Keeping a map current isn’t a one-and-done job; it's a constant, ongoing process of data maintenance.
If your data is stale, it can lead to all sorts of problems—inefficient routes, missed deliveries, and, in our world, critical delays when responding to an emergency. This relentless need for fresh, verified information is a massive operational challenge for any organization that depends on good mapping.
Ready to see how modern mapping can seriously change how your team operates? Resgrid brings dispatch, tracking, and communication all into one unified platform, giving your crew the real-time situational awareness they need to get the job done right. Learn how Resgrid can streamline your workflow and save critical time and money.